Observability (Tracing, Metrics)
1. Tracing
Features
In config_standalone.json, there is a paragraph about trace configuration as follows:
[
  "tracing": {
    "enable": true,
    "driver": "SOFATracer",
    "config": {
      "generator": "mosntracing",
      "exporter": ["stdout"]
    }
  }
]
This configuration can turn on the trace capability of layotto, allowing layotto to print the tracing log after receiving the request. The user can specify the way of exporting the trace log and generating fields such as spanId and traceId through configuration.
You can start a layotto server as follows:
- Build
cd cmd/layotto_multiple_api/
# build it
go build -o layotto
- Run it
./layotto start -c ../../configs/config_standalone.json
The corresponding client demo is in client.go, running it will call the SayHello API of layotto:
 cd ${project_path}/demo/flowcontrol/
 go build -o client
 ./client
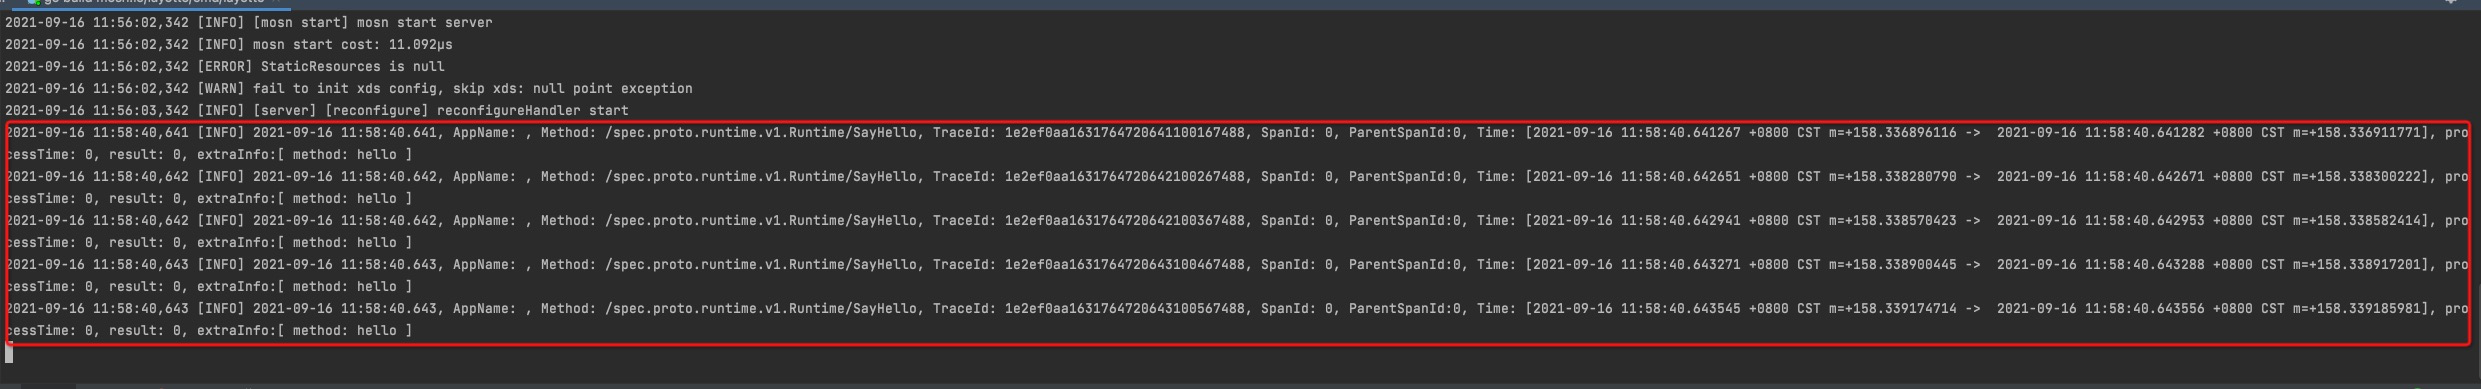
Check the log of layotto, you will see the detailed tracking log printed out:
Configuration parameter description
Trace configuration:
| Field name | Field type | Description |
|---|---|---|
| enable | boolean | Global switch, whether to enable trace |
| driver | String | driver represents the type of trace, mosn has SOFATracer and skywalking, users can expand |
| config | Object | Trace expansion configuration |
Trace expansion configuration:
| Field name | Field type | Description |
|---|---|---|
| generator | String | SpanId, traceId and other resource generation methods, users can expand by themselves |
| exporter | Array | The way users need to report by trace can be implemented and expanded by themselves |
Trace mechanism
Tracing in Layotto is mainly to record grpc calls, which relies on two interceptors added in grpc: UnaryInterceptorFilter 、 StreamInterceptorFilter
The interceptor will start tracing every time the grpc method is called, generate traceId spanId, a new context, record the method name, time, and pass the tracing information through the context, and finally export the span information when the method returns.
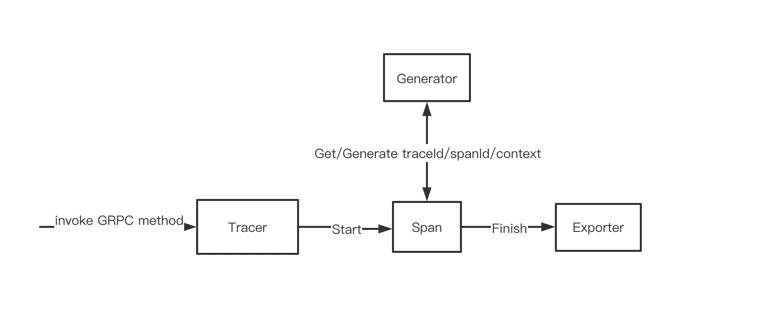
More details about the tracing framework
Overall diagram of the tracing framework:
Span structure:
type Span struct {
    StartTime time.Time //The time when the request was received
    EndTime time.Time //Returned time
    traceId string //traceId
    spanId string //spanId
    parentSpanId string // parent spanId
    tags [xprotocol.TRACE_END]string //Expand the field, the component can store its own information in this field
    operationName string
}
The Span structure defines the data structure passed between layotto and its component, as shown in the following figure, component can pass its own information to layotto through tags, and layotto does Unified trace report:
generator interface:
type Generator interface {
    GetTraceId(ctx context.Context) string
    GetSpanId(ctx context.Context) string
    GenerateNewContext(ctx context.Context, span api.Span) context.Context
    GetParentSpanId(ctx context.Context) string
}
This interface corresponds to the generator configuration above. This interface is mainly used to generate traceId, spanId according to the received context, obtain the parent spanId and the function of the context passed to the component, the user You can implement your own Generator, you can refer to the implementation of OpenGenerator in the code.
Exporter interface:
type Exporter interface {
    ExportSpan(s *Span)
}
The exporter interface defines how to report Span information to the remote end, corresponding to the exporter field in the configuration, which is an array and can be reported to multiple servers. Can Refer to the implementation of StdoutExporter, which will print trace information to standard output.
Span context transfer:
Layotto side
GenerateNewContext(ctx context.Context, span api.Span) context.Context
GenerateNewContext is used to generate a new context, and Layotto use the variable ability of Mosn to realize the transfer of Span information between contexts:
_ = variable.Set(ctx, types.VariableTraceSpan, span)
You can refer to the implementation of OpenGenerator in the code
Component side
On the Component side, you can insert component information through SetExtraComponentInfo, For example, the following operations are performed in the etcd configStore component:
trace.SetExtraComponentInfo(ctx, fmt.Sprintf("method: %+v, store: %+v", "Get", "etcd"))
The results printed by trace are as follows:
2. Metrics
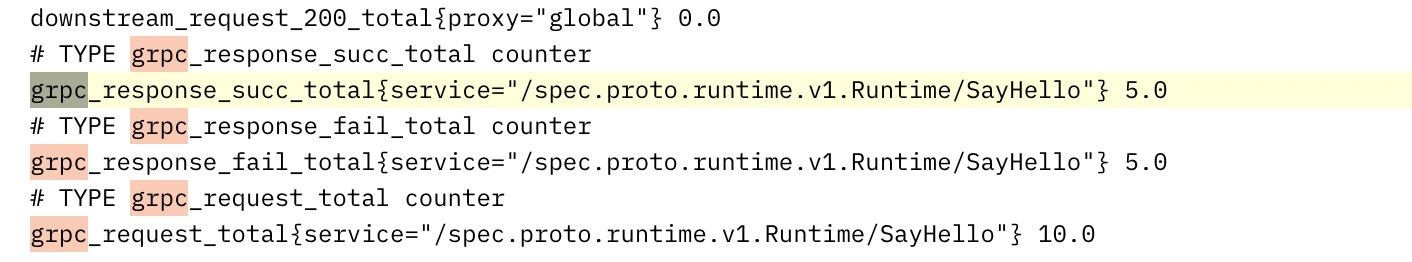
Layotto's metric reuses mosn's metric, and connects to prometheus. An example of metric configuration is provided in config_standalone.json, follow the above steps to start layotto After that, you can read the metric information through the following command:
curl --location --request GET 'http://127.0.0.1:34903/metrics'
The result is shown below:
For the metric principle of mosn, please refer to mosn official document