可观测性
1. Trace管理
功能介绍
在config_standalone.json 中,有一段关于trace的配置如下:
[
  "tracing": {
    "enable": true,
    "driver": "SOFATracer",
    "config": {
      "generator": "mosntracing",
      "exporter": ["stdout"]
    }
  }
]
这段配置可以开启layotto的trace能力,让layotto在接到请求后打印链路追踪日志。用户可以通过配置来指定trace日志上报的方式,以及spanId,traceId等字段的生成方式。
可以按照如下方式启动一个layotto的server:
构建:
cd cmd/layotto_multiple_api/
# build it
go build -o layotto
运行:
./layotto start -c ../../configs/config_standalone.json
对应的调用端代码在client.go 中,运行它会调用layotto的SayHello接口:
 cd ${project_path}/demo/flowcontrol/
 go build -o client
 ./client
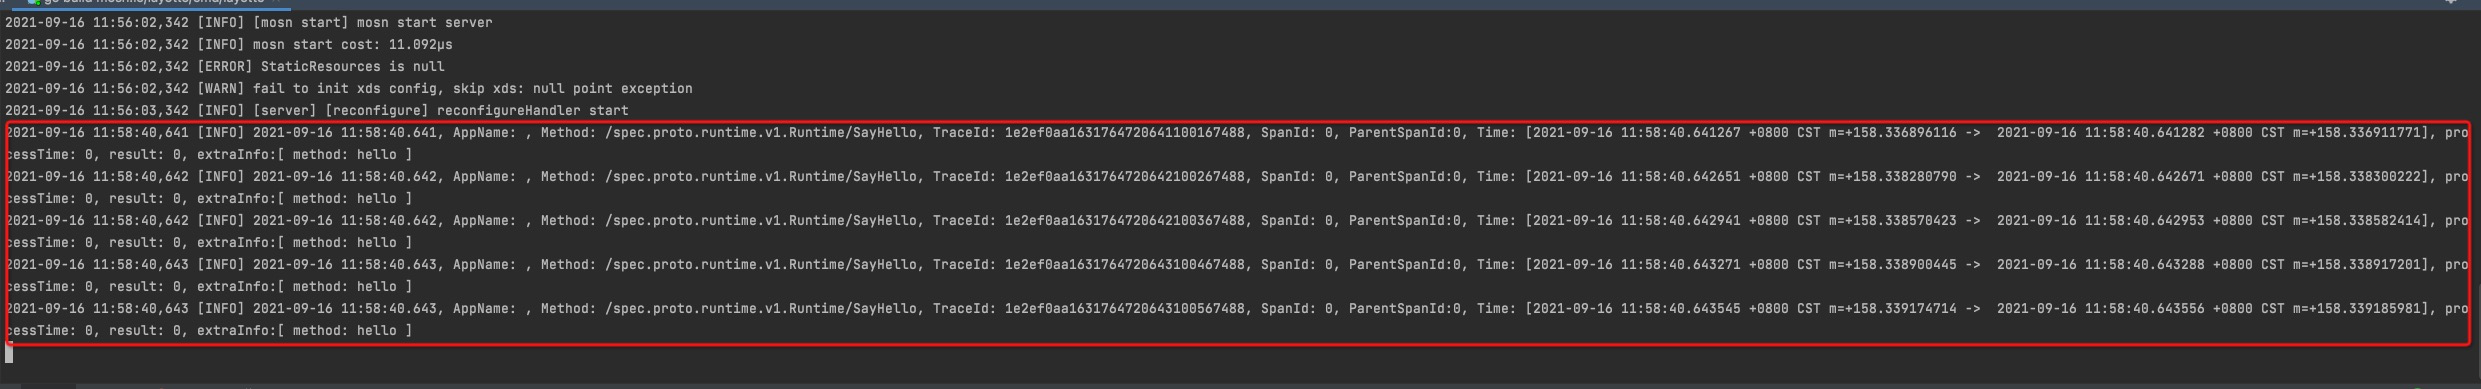
查看layotto的日志,会看到打印出详细的链路追踪日志:
配置参数说明
trace配置:
| 字段名 | 字段类型 | 说明 |
|---|---|---|
| enable | boolean | 全局开关,是否开启trace |
| driver | String | driver是代表trace的类型,mosn现有SOFATracer和skywalking,用户可以拓展 |
| config | Object | trace的拓展配置 |
trace拓展配置:
| 字段名 | 字段类型 | 说明 |
|---|---|---|
| generator | String | spanId,traceId等资源的生成方式,用户可自行拓展 |
| exporter | Array | 用户需要trace上报的方式,可自行实现和拓展 |
Trace 原理
Layotto中的 Tracing 会对grpc调用进行记录,依赖于在grpc里添加的两个拦截器: UnaryInterceptorFilter 、 StreamInterceptorFilter
拦截器在每次grpc方法调用时都会开启一次tracing,生成traceId spanId、新的context,记录方法名、时间,并且会将tracing信息通过context透传下去,请求处理结束后会将span信息导出。
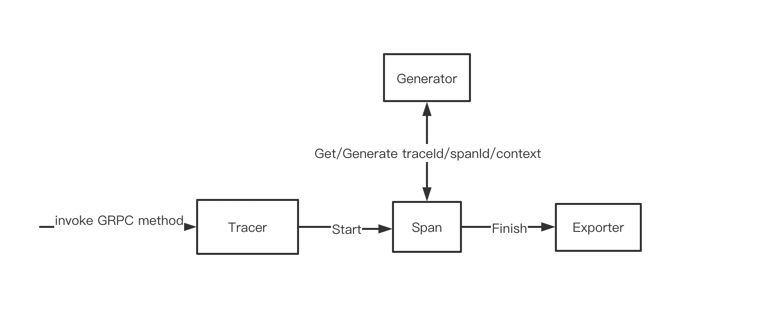
Trace 框架的设计
整体结构图:
Span结构:
type Span struct {
    StartTime     time.Time //收到请求的时间
    EndTime       time.Time //返回的时间
    traceId       string   //traceId
    spanId        string  //spanId
    parentSpanId  string  //父spanId
    tags          [xprotocol.TRACE_END]string //拓展字段,component可以将自己的信息存放到该字段
    operationName string
}
Span结构定义了layotto和其component之间传递的数据结构,如下图所示,component可以通过tags将自己的信息传递到layotto,layotto做 统一的trace上报:
Generator接口:
type Generator interface {
    GetTraceId(ctx context.Context) string
    GetSpanId(ctx context.Context) string
    GenerateNewContext(ctx context.Context, span api.Span) context.Context
    GetParentSpanId(ctx context.Context) string
}
该接口对应上面的generator配置,该接口主要用来根据收到的context生成traceId,spanId,获得父spanId以及传递给组件的context的功能,用户 可以实现自己的Generator,可以参考代码中的OpenGenerator 的实现。
Exporter接口:
type Exporter interface {
    ExportSpan(s *Span)
}
exporter接口定了如何将Span的信息上报给远端,对应配置中的exporter字段,该字段是个数组,可以上报给多个服务端。可以 参照StdoutExporter 的实现,该实现将trace的信息打印到标准输出。
Span的上下文传递:
Layotto侧
GenerateNewContext(ctx context.Context, span api.Span) context.Context
GenerateNewContext用于生成新的context,Layotto通过Mosn的variable能力实现Span信息在上下文之间的传递:
_ = variable.Set(ctx, types.VariableTraceSpan, span)
可以参考代码中的OpenGenerator 的实现
Component侧
在Component侧可以通过SetExtraComponentInfo 塞入component的信息, 比如在etcd configStore组件 执行了以下操作:
trace.SetExtraComponentInfo(ctx, fmt.Sprintf("method: %+v, store: %+v", "Get", "etcd"))
trace打印的结果如下:
2. Metrics管理
layotto 复用了 mosn 的 Metrics 功能,可以对接各种 Metrics 平台,比如 prometheus。
config_standalone.json 中提供了metric配置的示例,按照上述步骤启动layotto后,可以通过以下指令读取 metrics 信息:
curl --location --request GET 'http://127.0.0.1:34903/metrics'
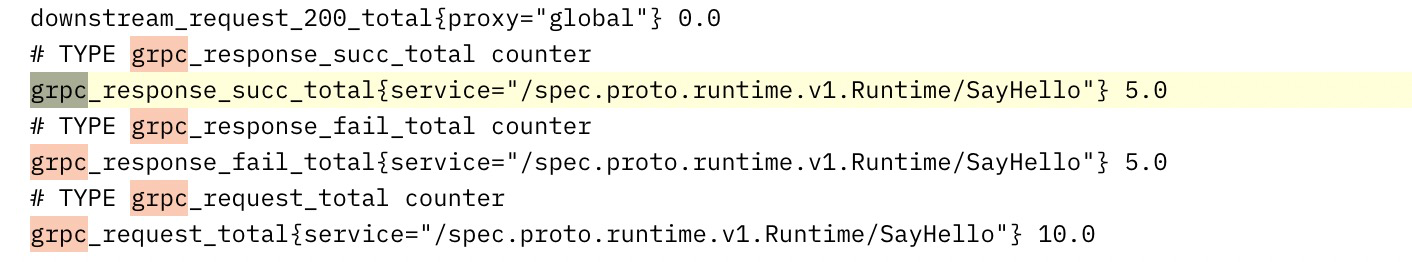
结果如下图所示:
配置解释
解释一下config_standalone.json 里 metrics 相关配置
埋点、统计

图中标红的这段配置会启用mosn的"grpc_metric" filter。这个filter的作用是在每次处理完grpc请求后,统计服务名、成功还是失败等信息,存在内存中。
详见 mosn代码
展示metrics数据
  "metrics": {
    "sinks": [
      {
        "type": "prometheus",
        "config": {
          "port": 34903
        }
      }
    ]
  }
这段其实也是mosn的配置,会打开34903端口,按 prometheus 的数据格式返回内存中的 metrics 指标。
更多细节
mosn的 metrics 原理可以参照 mosn官方文档